前回は3軸加速度センサKXR94-2050モジュールを使用して加速度データをXBeeを用いて無線送信する方法を解説しました。今回はローカルXBeeで受信したフレームからX,Y,Z軸方向の加速度データを読み取り、Processing を用いてリアルタイムでデータを表示するスクロールグラフをご紹介します。
Processingについては5月24日の「XBeeモジュールの使い方(アナログ温度センサの温度データ可視化)」の記事を参考にしてください。今回はこのときの記事で記載した設定条件でスクロールグラフを作成しました。
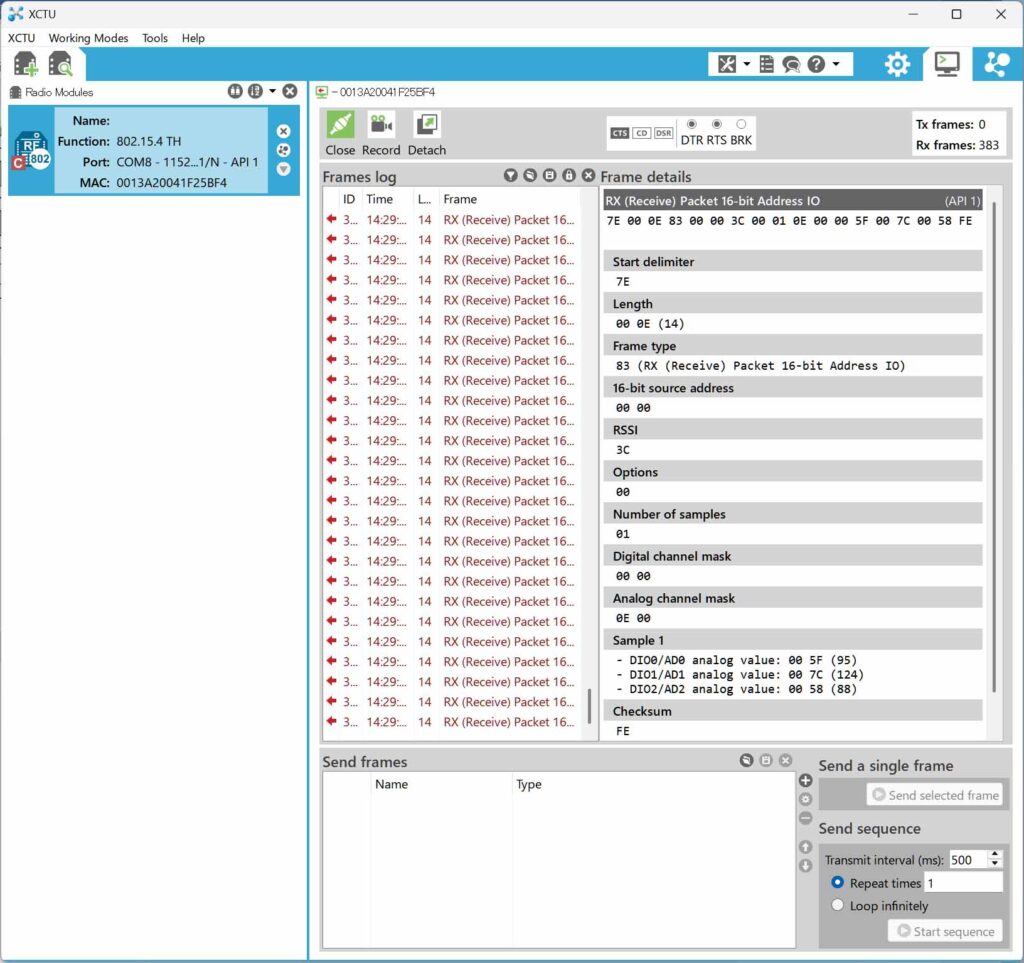
下の画像は前回の解説で示したローカルXBeeが受信するフレームを再掲しております。今回はこのフレームの中からProcessing を用いて加速度データを読み取り描画します。
以下のコードで加速度データをスクロールグラフで表示できます。以下のコードをProcessingで実行する前に、ローカルXBeeとのシリアル通信のCOMポート番号とボーレートを33行目に入力してください。
xbee = new Serial (this, “COM7”, 115200);
import processing.serial.*;
import java.util.ArrayList;
import java.io.PrintWriter; // CSV
import java.util.Date;
import java.text.SimpleDateFormat;

Serial xbee; ///Xeeからの入力シリアルポート
byte[] packet = new byte[18]; //受信パケット
int byteCounter; //keeps track of where you are in the packet
int fontSize = 24; // size of the text on the screen
int lastReading = 0; //value of the previous incoming byte
int rssi = 0; // received signal strength
int dc = 0; //データ数
boolean dataStarted = false; // データの受信開始フラグ
int bufferIndex = 0; //
ArrayList<Integer> xData = new ArrayList<>(); //X Data
ArrayList<Integer> yData = new ArrayList<>(); //Y Data
ArrayList<Integer> zData = new ArrayList<>(); //Z Data
int MSBx, LSBx, MSBy, LSBy, MSBz, LSBz;
int thisSamplex = (MSBx * 256) + LSBx;
int thisSampley = (MSBy * 256) + LSBy;
int thisSamplez = (MSBz * 256) + LSBz;
int maxDataPoints = 100; // 表示するデータポイントの最大数
PrintWriter output; // CSV Printeriter
boolean saved = false; //保存フラグ

void setup() {
  size (1520, 780);
  PFont myFont = createFont (PFont. list()[5], 24);
  textFont (myFont);

  println(Serial. list());
  xbee = new Serial (this, "COM7", 115200);
  //デスクトップパスを取得
  String desktopPath = sketchPath();
  println(desktopPath);
  // デスクトップに Dataフォルダを作成
  String dataFolderPath = desktopPath + "/Data";

  // CSVファイルを「Data」フォルダ内に作成
  String timestamp = timestamp();
  String fileName = dataFolderPath + timestamp +".csv";
  output = createWriter(fileName);
  output. println("X,Y,Z");
}

void draw() {
  background (0);
  stroke (255, 255, 255);
  line(0, 260, 1520, 260);
  line (0, 520, 1520, 520);

  strokeWeight (2);
  noFill ();
  stroke(100); // 薄いグレー
  textSize(16);

  for (int i = 0; i <= 10; i++) {
    // X軸グラフの横線とラベル
    line(50, i*26, width, i*26);

    // Y軸グラフの横線とラベル
    line(50, i*26+260, width, i*26+260);

    // Z軸グラフの横線とラベル
    line(50, i*26+520, width, i*26+520);
  }
  textSize(26);
  text("X", 8, 130);
  text("Y", 8, 130+260);
  text("Z", 8, 130+260*2);

  stroke (255, 255, 255);
  line(0, 260, 1520, 260);
  line (0, 520, 1520, 520);

  //Xデータ
  stroke (255, 0, 0); // red
  beginShape();
  for (int i = 0; i < xData.size(); i++) {
    float x = map(i, 0, maxDataPoints, width - 50, 50);
    float y = map(xData.get(i), 0, 1023, height -500, - 50);
    vertex (x, y);
  }
  endShape();

  //Yデータ
  stroke (0, 255, 0); // green
  beginShape();
  for (int i = 0; i < yData.size(); i++) {
    float x = map(i, 0, maxDataPoints, width - 50, 50);
    float y = map(yData.get(i), 0, 1023, 50, height - 50);
    vertex (x, y);
  }
  endShape();

  //Zデータ
  stroke (244, 229, 17); // blue
  beginShape();
  for (int i = 0; i < zData.size(); i++) {
    float x = map(i, 0, maxDataPoints, width - 50, 50);
    float y = map(zData.get(i), 0, 1023, 450, height - 50);
    vertex (x, y);
  }
  endShape();
  fill (255);
}

void serialEvent (Serial xbee) {
  int thisByte = xbee.read();
  if (!dataStarted && thisByte == 0x7E) {
    dataStarted = true;
    bufferIndex = 0;
    packet [bufferIndex++] = (byte) thisByte;
  } else if (dataStarted) {
    packet [bufferIndex++] = (byte) thisByte;
    if (bufferIndex == 18) {
      parseData (packet);
      dataStarted = false;
    }
  }
}

void parseData(byte[] packet) {
  int adcStart = 11;
  MSBx = int (packet[adcStart]);
  LSBx = int (packet[adcStart + 1]);
  println ("MSB=" +  MSBx + "  LSB=" + LSBx);
  thisSamplex = (MSBx * 256) + LSBx;
  println("X: " + thisSamplex);

  MSBy = int (packet[adcStart + 2]);
  LSBy = int (packet[adcStart + 3]);
  println ("MSB=" +  MSBy + "   LSB=" + LSBy);
  thisSampley = (MSBy * 256) + LSBy;
  println("Y: " + thisSampley);

  MSBz = int (packet[adcStart + 4]);
  LSBz = int (packet[adcStart + 5]);
  println ("MSB=" +  MSBz + "   LSB=" + LSBz);
  thisSamplez = (MSBz * 256) + LSBz;
  println("Z: " + thisSamplez);

  println("  -------------   ");
  //CSVファイルにデータを書き込む
  output.println(thisSamplex + "," + thisSampley + "," + thisSamplez);
  dc++;
  //データをリストに追加
  xData.add (thisSamplex);
  yData.add (thisSampley);
  zData.add (thisSamplez);
  //最大データポイント数を超えたら古いデータを削除
  if (xData.size() > maxDataPoints) {
    xData.remove (0);
    yData.remove (0);
    zData.remove (0);
  }
}

void keyPressed() {
  if (key == 's'&& !saved  || key == 'S'&& !saved ) {
    //s or Sキーを押すとファイルをタイムスタンプ付きのファイル名で保存
    output.flush(); //現在のデータを書き込む
    output. close(); // file close
    exit(); //スケッチ終了
  }
}

String timestamp() {
  Date date = new Date();
  SimpleDateFormat sdf = new SimpleDateFormat("yyMMdd-HHmmss-SSS") ;
  return sdf.format (date);
}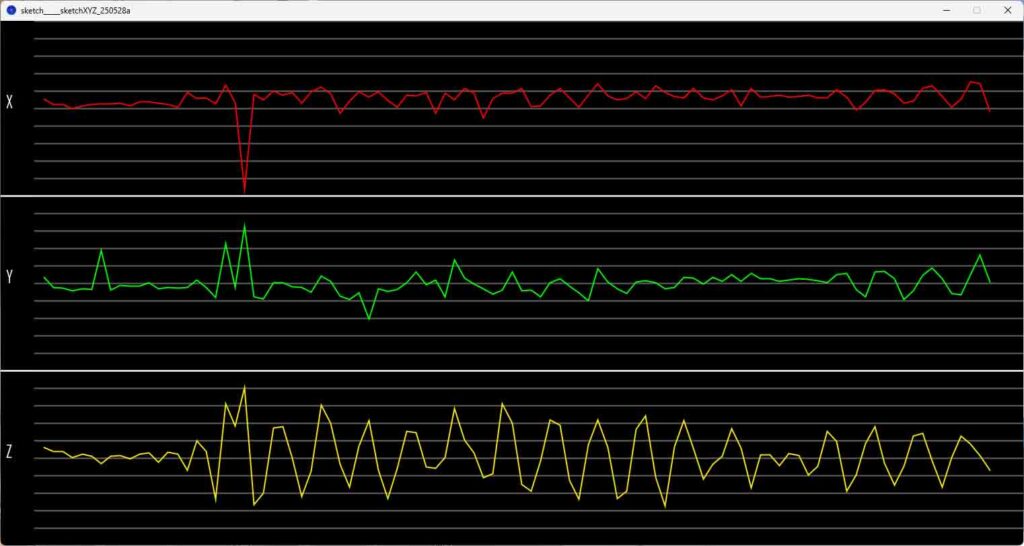
プログラムを停止する場合はマウスでスクロールグラフを左クリックしてから「s」または「S」キーを押してください。Processingのスケッチが保存されているフォルダにタイムスタンプの付いたファイル名でcsv形式でデータが保存されます。今回はサンプリング間隔が100msでしたが、リモートXBeeのIR Sample Rateを変更することでお好みのサンプリングで加速度データを取得できます。 尚、XBee Series 1(802.15.4) には 「エスケープ処理(Escape Mode)」 の概念は 存在しないため、今回はフレームからデータを読み込む際にエスケープ処理はしていません。