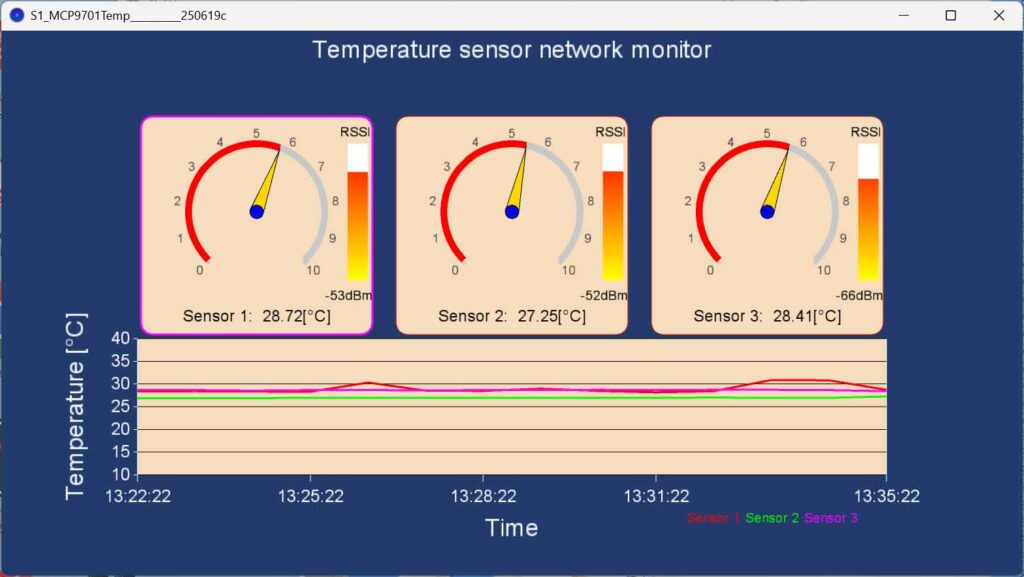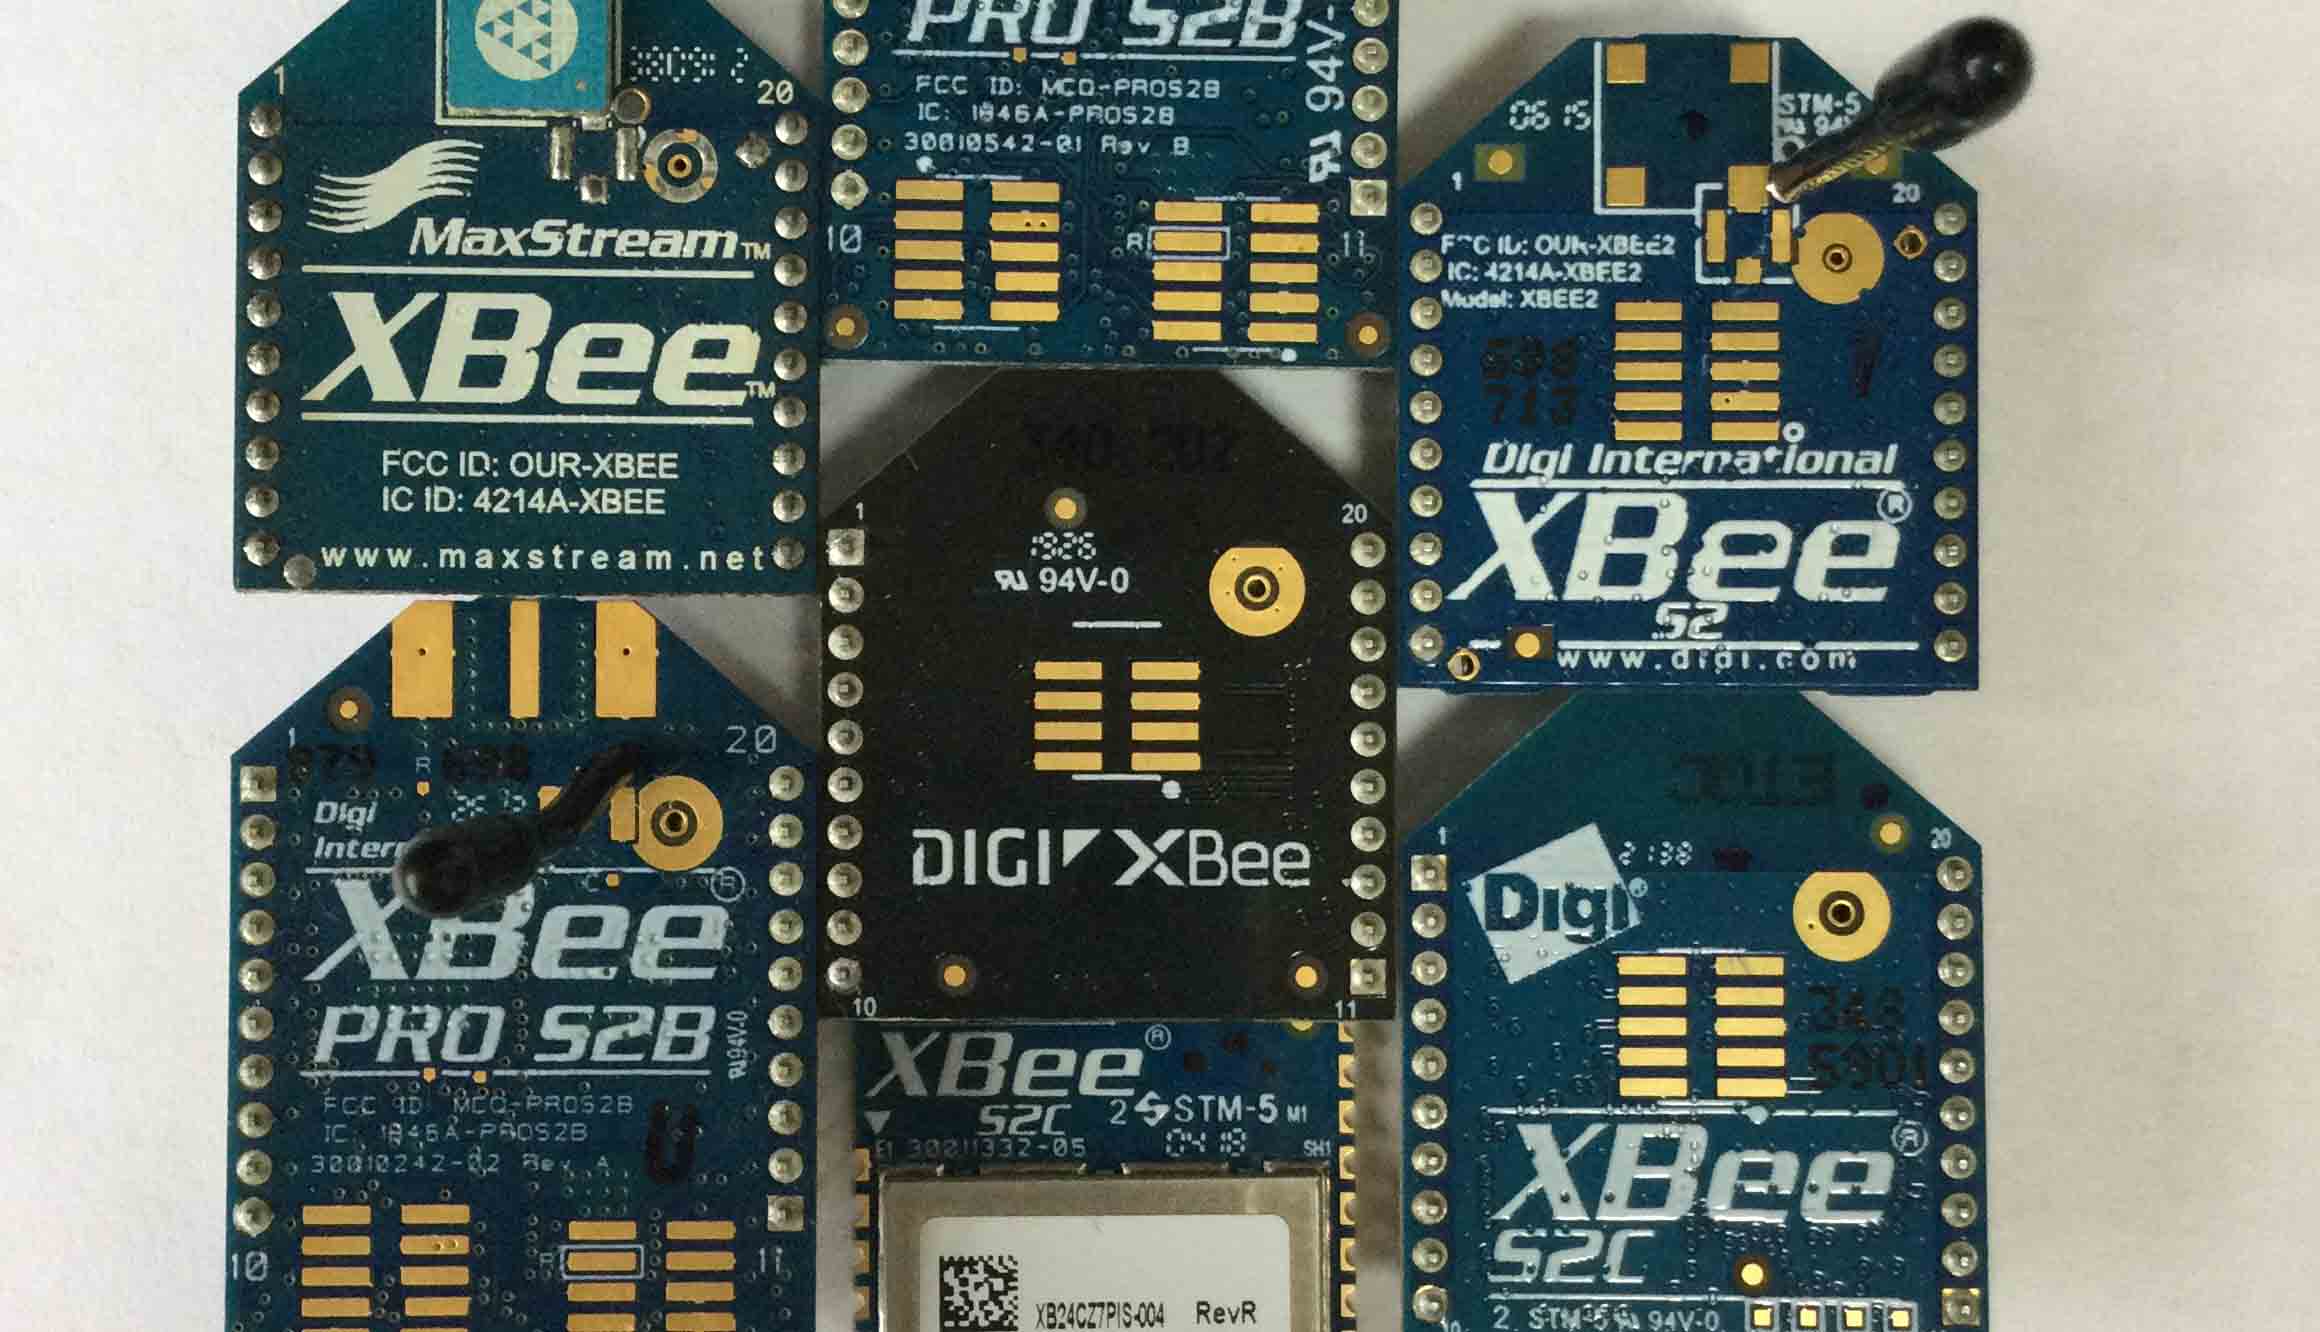
前回はファームウェアを802.15.4に設定しアナログ温度センサMCP9701(Microchip社製)を3個のエンドデバイスXBeeに接続し、Cyclic Sleep Modeを用いて60秒間隔でコーディネータXBeeに温度結果を送信しました。今回はコーディネータXBeeで受信した3個のエンドデバイスXBee からの温度データやRSSIを読み取り、Processing を用いてリアルタイムでデータを表示するスクロールグラフをご紹介します。
Processingについては5月24日の「XBeeモジュールの使い方(アナログ温度センサの温度データ可視化)」の記事を参考にしてください。今回はこのときの記事で記載した設定条件でスクロールグラフを作成しました。
以下のコードで3個のエンドデバイスの温度データをスクロールグラフで表示します。以下のコードをProcessingで実行する前に、ローカルXBeeとのシリアル通信のCOMポート番号とボーレートを48行目に入力してください。
xbee = new Serial(this, “COM14”, 9600);
また28行目では温度データをcsvファイルに保管するインターバルを設定することができます。デフォルトでは1時間に設定しています。
int interval = 3600000; // 1時間 ミリ秒で指定 10分=600,000ミリ秒
import processing.serial.*;
import java.io.PrintWriter;
import java.text.SimpleDateFormat;
import java.util.Date;
import java.util.ArrayList;

Serial xbee;                    // input serial port from the Xbee Radio
int[] packet = new int[14];     // with 5 samples, the Xbee packet is 24bytes long
int byteCounter;                // keeps track of where you are in the packet
int fontSize = 24;              // size of the text on the screen
int dc = 0;                     // データ数
int Addr = 0;
int addrRead = 0;
int RSSI = 0;
byte thisSample1;
float minTemp = 10;
float maxTemp = 40;
float tempkizami = 0;
String address;                 // sender's address
float Signal = 0;               // average of the sensor data
float Signalv = 0;
int firstRectPos = 25;          // horizontal pos of the first graph bar

int AddrNum = 3; // アドレスの数
ArrayList<Float>[] signals = new ArrayList[AddrNum]; // 各アドレスごとの温度データを保存するリスト
ArrayList<Float>[] timeSeriesData = new ArrayList[AddrNum]; // 各アドレスごとの時系列データを保存するリスト
ArrayList<String>[] timeLabels = new ArrayList[AddrNum]; // 各アドレスごとの時間ラベルを保存するリスト
int interval = 3600000; // 1時間 ミリ秒で指定 10分=600,000ミリ秒
int lastSaveTime = 0; // 最後にデータを保存した時間

float[] temperatures = new float[AddrNum];
float[] rssiValues = new float[AddrNum];
PFont font;

void setup() {
  size(1500, 800, P3D); // ウィンドウサイズを大きくしてNumSensor個のメータを表示
  surface.setResizable(true);
  frameRate(1);  // 1秒間隔で更新
  font = createFont("MS P明朝", 20);
  textFont(font);

  // create a font with the second font available to the system:
  PFont myFont = createFont(PFont.list()[5], fontSize);
  textFont(myFont);
  // get a list of the serial ports:
  println(Serial.list());
  // open the serial port attached to your Xbee radio:
  xbee = new Serial(this, "COM14", 9600);

  // 初期化
  for (int i = 0; i < AddrNum; i++) {
    signals[i] = new ArrayList<Float>();
    timeSeriesData[i] = new ArrayList<Float>();
    timeLabels[i] = new ArrayList<String>();
  }
  lastSaveTime = millis();
}

void draw() {
  background(35, 59, 108);

  // set the background:
  fill(255, 255, 0);

  // 各メータの位置とサイズ
  float meterSize = 200;
  float[] meterX = new float[10];
  for (int i = 0; i < AddrNum; i++) {
   meterX[i] = (1 + i) * width / (AddrNum + 1);
  }
  float meterY = height / 3;

  for (int i = 0; i < AddrNum; i++) {
    fill(245, 220, 189);
    rect(meterX[i] - 170, meterY - 140, 340, 320, 20);
    drawMeter(meterX[i], meterY, meterSize, temperatures[i], rssiValues[i], i + 1);
  }

  // 時系列データのグラフ描画
  drawTimeSeriesGraph();

  // 指定の時間が経過したらデータを保存
  if (millis() - lastSaveTime > interval) {
    saveData();
    lastSaveTime = millis();
  }
}

void drawBar(int rectHeight, int rectWidth, int rectNum ) {
  if (rectHeight > 0 ) {
    stroke(255, 127, 0);
    fill(123, 255, 0);
  }
}

void serialEvent(Serial xbee) {
  int thisByte = xbee.read();
  if (thisByte == 0x7E) {   // start byte
    if (packet[5] > 0) {
      parseAddr(packet);
    }
    if (packet[6] > 0) {
      parseRSSI(packet);
    }
    // parse the previous packet if there's data:
    if (packet[11] > 0) {
      parseData(packet);
    }
    // reset the byte counter:
    byteCounter = 0;
  }
  // put the current byte into the packet at the current position:
  packet[byteCounter] = thisByte;
  //  increment the byte counter:
  byteCounter++;
}

void parseRSSI(int[] thisPacket) {
  int RSSI_StartByte = 6;
  RSSI = -thisPacket[RSSI_StartByte];
  rssiValues[Addr - 1] = RSSI;
  println("RSSI:" + RSSI);
}

void parseAddr(int[] thisPacket) {
  int addrRead = 5;
  Addr = thisPacket[addrRead];
  println("Addr:" + Addr);
}

void parseData(int[] thisPacket) {
  int adcStart = 11;              // ADC reading starts at

  // ADC 10-bit value = high byte * 256 + low byte:
  int thisSample = (thisPacket[adcStart] * 256) + thisPacket[1 + adcStart];
  println(thisPacket[adcStart]);
  println(thisPacket[1 + adcStart]);
  //Signalv = float(thisSample) / 310;    //  for LM90
  Signalv = float(thisSample) / 838.5;  // for MCP8701
  println(Signalv);
  //Signal = sqrt(2196200+(1.8639-Signalv)/(3.88E-6)) - 1481.96;  // for LM90
  Signal = (Signalv*1000 - 400) / 19.5; // for MCP9701
  println("Signal:" + Signal);

  // アドレスに応じてデータを保存
  if (Addr >= 1 && Addr <= AddrNum) {
    signals[Addr - 1].add(Signal);
    temperatures[Addr - 1] = Signal;
    timeSeriesData[Addr - 1].add(Signal); // 時系列データに追加
    timeLabels[Addr - 1].add(new SimpleDateFormat("HH:mm:ss").format(new Date())); // 時間ラベルを追加
  }
}

void saveData() {
  String timestamp = new SimpleDateFormat("yyyyMMdd_HHmmss").format(new Date());
  String fileName = "C:/Users/kurita/Desktop/TempData/TempData_" + timestamp + ".csv";
  PrintWriter output = createWriter(fileName);

  // ヘッダー行の作成
  String header = "Time";
  for (int i = 0; i < AddrNum; i++) {
    header += ",Addr " + (i + 1);
  }
  output.println(header);

  // データ行の作成
  int maxRows = 0;
  for (int i = 0; i < AddrNum; i++) {
    maxRows = max(maxRows, signals[i].size());
  }

  for (int row = 0; row < maxRows; row++) {
    String line = "";
    for (int col = 0; col < AddrNum; col++) {
      if (col > 0) line += ",";
      if (row < timeLabels[col].size()) {
        line += timeLabels[col].get(row) + ",";
      } else {
        line += ",";
      }
      if (row < signals[col].size()) {
        line += signals[col].get(row);
      }
    }
    output.println(line);
  }

  output.flush();
  output.close();

  println("Data saved to " + fileName);

  // データのリセット
  for (int i = 0; i < AddrNum; i++) {
    signals[i].clear();
    timeSeriesData[i].clear();
    timeLabels[i].clear();
  }
}

void drawMeter(float meterX, float meterY, float meterSize, float temperature, float rssi, int sensorID) {
  pushStyle();
  // 温度スケール
  float minTemp = 0;
  float maxTemp = 50;

  // 温度を表示する角度の計算 (左に90度回転)
  float startAngle = radians(-225);
  float endAngle = radians(45);
  float angle = map(temperature, minTemp, maxTemp, startAngle, endAngle);

  // メータのバックグラウンド
  stroke(200);
  strokeWeight(10);
  //fill(200, 200, 200);
  noFill();
  arc(meterX, meterY, meterSize, meterSize, startAngle, endAngle);

  // メータの目盛り
  int tickCount = 10;
  for (int i = 0; i <= tickCount; i++) {
    float tickAngle = map(i, 0, tickCount, startAngle, endAngle);
    float x1 = meterX + cos(tickAngle) * meterSize / 2;
    float y1 = meterY + sin(tickAngle) * meterSize / 2;
    float x2 = meterX + cos(tickAngle) * meterSize / 1.9;
    float y2 = meterY + sin(tickAngle) * meterSize / 1.9;
    line(x1, y1, x2, y2);

    // メモリ値の表示
    fill(70);
    textSize(19);
    textAlign(CENTER, CENTER);
    float labelX = meterX + cos(tickAngle) * meterSize / 1.7;
    float labelY = meterY + sin(tickAngle) * meterSize / 1.7;
    text(int(i), labelX, labelY);
  }

  // 温度を表示する部分
  stroke(255, 0, 0);  // 赤色
  strokeWeight(10);
  fill(245, 220, 189);
  arc(meterX, meterY, meterSize, meterSize, startAngle, angle);

  // 指示針の描画(黒色の三角矢印)
  fill(255, 215, 0);
  stroke(0);
  strokeWeight(1);
  float needleLength = meterSize / 2.0;
  float arrowSize = 10;
  float x1 = meterX + cos(angle) * needleLength;
  float y1 = meterY + sin(angle) * needleLength;
  float x2 = meterX + cos(angle + radians(90)) * arrowSize;
  float y2 = meterY + sin(angle + radians(90)) * arrowSize;
  float x3 = meterX + cos(angle - radians(90)) * arrowSize;
  float y3 = meterY + sin(angle - radians(90)) * arrowSize;
  float x4 = meterX + cos(angle) * (needleLength - arrowSize);
  float y4 = meterY + sin(angle) * (needleLength - arrowSize);

  beginShape();
  vertex(x1, y1);
  vertex(x2, y2);
  vertex(x3, y3);
  vertex(x4, y4);
  endShape(CLOSE);

  fill(0, 0, 255);  // 針の軸を青に塗りつぶす
  ellipse(meterX, meterY, 20, 20);

  // 現在の温度をテキストで表示
  fill(0);
  textSize(24);
  textAlign(CENTER, CENTER);
  text("Sensor " + sensorID + ":  " + nf(temperature, 1, 2) + "[°C]", meterX, meterY + meterSize / 2 + 50);

  // RSSIのカラーグラデーションバーを表示
  float rssiBarWidth = 30;
  float rssiBarHeight = meterSize;
  float rssiBarX = meterX + meterSize / 1.5;
  float rssiBarY = meterY + meterSize / 2 - rssiBarHeight;
  float rssiLength = map(rssi, -255, 0, 0, rssiBarHeight);

  // RSSIのバックグラウンドを白で表示
  fill(255);
  noStroke();
  rect(rssiBarX, rssiBarY, rssiBarWidth, rssiBarHeight);

  // RSSIのカラーグラデーションバー
  for (int i = 0; i < rssiLength; i++) {
    float inter = map(i, 0, rssiBarHeight, 1.0, 0.0);
    int c = lerpColor(color(255, 0, 0), color(255, 255, 0), inter); // 赤から黄色のグラデーション
    stroke(c);
    line(rssiBarX, rssiBarY + rssiBarHeight - i, rssiBarX + rssiBarWidth, rssiBarY + rssiBarHeight - i);
  }

  // 信号が最大のときにバーの周囲を黒線で囲む
  if (rssi >= -50) {
    stroke(0);
    noFill();
    rect(rssiBarX, rssiBarY, rssiBarWidth, rssiBarHeight);
  }

  // RSSIのラベルを表示
  fill(0);
  textSize(20);
  textAlign(CENTER, CENTER);
  text("RSSI", rssiBarX - 3 + rssiBarWidth / 2, rssiBarY - 20);

  // 現在のRSSIを数値で表示
  fill(0);
  textSize(20);
  textAlign(CENTER, CENTER);
  text(nf(rssi, 2, 0) + "dBm", rssiBarX - 13 + rssiBarWidth / 2, rssiBarY + rssiBarHeight + 20);
  popStyle();
}

void drawTimeSeriesGraph() {
  float graphX = 200;
  float graphY = height * 1.13 / 2;
  float graphWidth = width - 400;
  float graphHeight = 200;

  // グラフのバックグラウンド
  fill(245, 220, 189); // 肌色
  noStroke();
  rect(graphX, graphY, graphWidth, graphHeight);

  // グラフの枠を描画
  stroke(255);
  noFill();
  rect(graphX, graphY, graphWidth, graphHeight);

  // 縦軸の目盛りとラベルを表示
  fill(255);
  textSize(26);
  textAlign(CENTER);
  tempkizami = ( maxTemp - minTemp)/ 5;
  for (int i = 0; i <= tempkizami; i++) {
    float y = map(i, 0, tempkizami, graphY + graphHeight, graphY);
    stroke(0, 0, 0);
    strokeWeight(1);
    line(graphX, y, graphX + graphWidth, y); // 目盛線を描画
    stroke(255, 255, 255);
    line(graphX - tempkizami, y, graphX, y);
    text(nf(minTemp + i * 5, 1, 0), graphX - 25, y + 8); // 10°Cから40°Cまでの目盛り
  }
  // グラフのタイトルを表示
  textSize(36);
  textAlign(CENTER);
  text("Temperature sensor network monitor", graphX + graphWidth / 2, 40);

  // センサーの色のラベルを表示
  textSize(20);
  textAlign(CENTER);
  fill(255, 0, 0);
  text("Sensor 1", graphX + graphWidth / 1.3, graphY + graphHeight + 70);
  fill(0, 255, 0);
  text("Sensor 2", graphX + graphWidth / 1.18, graphY + graphHeight + 70);
  fill(255, 0, 255);
  text("Sensor 3", graphX + graphWidth / 1.08, graphY + graphHeight + 70);

  // グラフのラベルを表示
  textSize(36);
  textAlign(CENTER);
  fill(255, 255, 255);
  text("Time", graphX + graphWidth / 2, graphY + graphHeight + 90);

  // 縦軸のラベルを縦書きで表示
  textSize(36);
  textAlign(CENTER);
  pushMatrix();
  translate(graphX - 80, graphY + graphHeight / 2);
  rotate(-PI / 2);
  text("Temperature [°C]", 0, 0);
  popMatrix();

  // 時間スケールを表示
  for (int i = 0; i < AddrNum; i++) {
    textSize(26);
    textAlign(CENTER);
    int numLabels = min(timeLabels[i].size(), 5); // 時間ラベルを5個以下に制限
    for (int j = 0; j < numLabels; j++) {
      int index = int(map(j, 0, numLabels - 1, 0, timeLabels[i].size() - 1));
      float x = map(index, 0, timeLabels[i].size() - 1, graphX, graphX + graphWidth);
      float y = graphY + graphHeight + 40;
      // 前の時間ラベルをバックグラウンドカラーで塗りつぶす
      fill(35, 59, 108); // バックグラウンドカラーと同じ色
      noStroke();
      rect(x - 50, y - 20, 100, 20);
      // 新たな時間ラベルを表示
      fill(255); // 白色で描画
      text(timeLabels[i].get(index), x, y);
      // 短い目盛線を描画
      stroke(255); // 白色の目盛線
      strokeWeight(1); // 細い線
      line(x, graphY + graphHeight, x, graphY + graphHeight + 10); // 短い目盛線
    }
  }

  // 各アドレスごとの温度データをプロット
  color[] colors = {color(255, 0, 0), color(0, 255, 0), color(255, 0, 255)};
  for (int i = 0; i < AddrNum; i++) {
    stroke(colors[i]);
    strokeWeight(3);
    noFill();
    beginShape();
    for (int j = 0; j < timeSeriesData[i].size(); j++) {
      float x = map(j, 0, timeSeriesData[i].size() - 1, graphX, graphX + graphWidth);
      float y = map(timeSeriesData[i].get(j), 10, 40, graphY + graphHeight, graphY);
      vertex(x, y);
    }
    endShape();
  }
}